

- Litecoin price analysis shows a downward trend.
- LTC has fallen below the previous support of $60.
- The support for the LTC price is currently at $56.0
Litecoin price analysis shows a sharp drop of almost 4.5% in Litecoin price. The decline seems to be due to a break of the bearish trend line on the 4-hour chart, rendering the recent bullish bias invalid. Strong support is currently at $56.0, below which the decline could extend to $50.0.
Over the weekend, there was a general market crash that also affected Litecoin. The LTC price is currently trading at $57.25 and it looks like the sell-off is not over yet. The market is still very volatile and a lot can happen in the short term. LTC has a total trading volume of $640,744,866.31 and is currently ranked 20th in the market.
Litecoin Price Analysis: Technical Analysis
Litecoin price analysis shows that the LTC price is currently in a downtrend and could extend its decline to $50.0 if it falls below the current support of around $56.0. On the downside, the next support levels are at $55.0 and $50.0, while on the upside, the key resistance levels are at $60.0 and $62.0. The RSI is currently in bearish territory below the 50 level, which further supports the bearish outlook for Litecoin prices in the near term.
LTC/USD 1-Day Price Chart
Analysis of the Litecoin price shows that it has been moving between $56.0 and $60.0 over the past few days. However, a break above one of these levels is needed for a clearer trend to emerge in the market. The moving averages are currently flat and not providing clear trading signals for the market. For example, the 20-day SMA is currently trading at $58.0, while the 50-day SMA is slightly below that level at around $57.5. Overall, the technical indicators are not providing clear trading signals for the market, and a breakout from the current trading range is needed for a clearer market direction to emerge.
Litecoin price analysis on the 4-hour chart shows that the price has dropped below the $60.0 support level after a bearish engulfing pattern formed on the chart. Price is currently testing the next support level at around $56.0, which could give short positions some short-term breathing room if broken.
The 4-hour chart for LTC/USD shows that the price has broken below the bullish trend line, which invalidates the recent bullish setup. Price is currently trading below $60.0, which could extend the decline to $56.0 if current support is broken. On the upside, bulls need to break above $60.0 to take control of the market. The main resistance is at $60.0 and $62.0, while on the downside support can be found at $56.0 and $50.0.
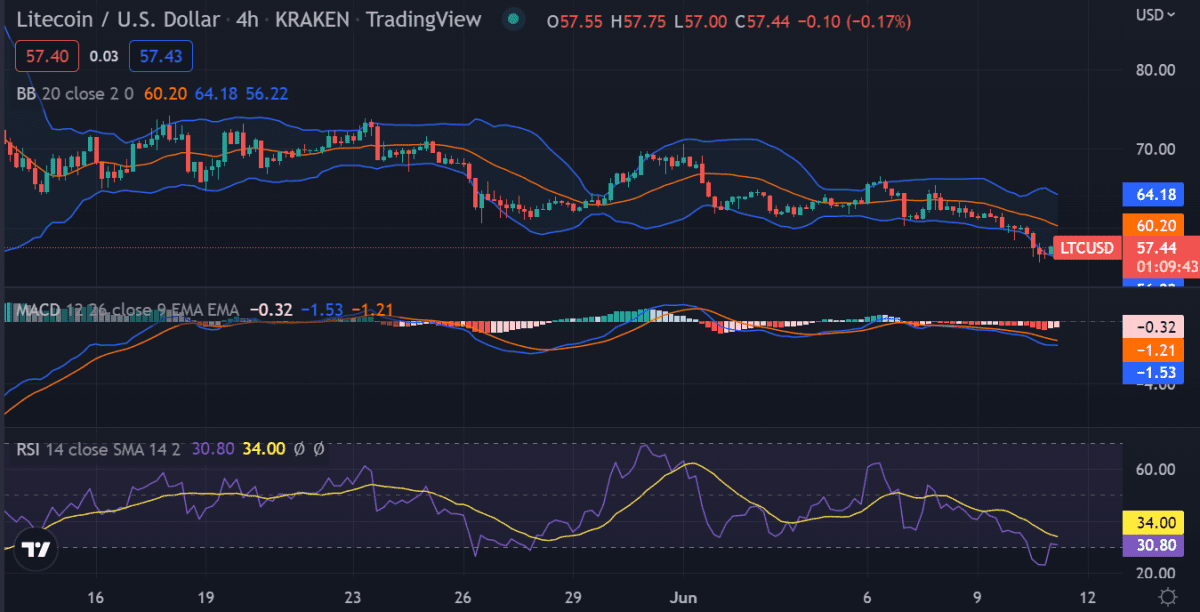
LTC/USD 4-Hour Price Chart
The MACD histogram shows that the current market sentiment is bearish and currently trading below the zero line. The RSI is also trading in bearish territory below the 50 levels, suggesting that the price could fall further in the short term. The Bollinger Bands on the 4-hour chart are currently contracting, suggesting that market volatility is currently low.
Litecoin Price Analysis Conclusion
Litecoin price analysis shows that the market has been moving in a narrow range over the past few days and a breakout is needed to see a clear market direction. Technical indicators are not providing clear trading signals for the market and if the current support level of around $56.0 is breached, the price could fall further.